
Thermal Stability of Drop-surf Fluorosurfactant in PCR and Reverse Transcription
1.Introduction
Droplet microfluidics technology has become a core tool in molecular biology experiments due to its high throughput, low sample consumption, and precise control capabilities, showing significant advantages in fields such as digital polymerase chain reaction (ddPCR) and single-cell analysis. Among these, the performance of surfactant determines the stability of the droplet system, affecting the accuracy and reproducibility of experimental results.
Thermal stability is a critical indicator for evaluating the suitability of surfactants in molecular biology experiments. Key steps such as reverse transcription and ddPCR involve medium to high-temperature reactions, imposing strict requirements on the heat resistance of surfactant. Reverse transcription requires maintaining enzyme activity at 40-50°C, followed by enzyme inactivation through high temperatures. ddPCR undergoes multiple cycles of high and low temperatures, where the droplet interface is susceptible to temperature fluctuations. Insufficient thermal stability can lead to issues such as droplet coalescence, interfering with experiments.
Drop-Surf, a commercially available fluorosurfactant widely employed in molecular biology experiments, has thermal stability directly related to droplet system stability and experimental result reliability. To objectively and comprehensively evaluate its core performance advantages, this study selected two internationally recognized fluorosurfactants, one from a French brand (hereinafter referred to as Brand F) and one from a U.S. brand (hereinafter referred to as Brand A), as controls. Through systematic comparative testing in two key molecular biology experimental scenarios, reverse transcription (RT) and ddPCR, we focused on thermal stability as the core performance indicator. This approach aims to provide robust data support and practical reference for the scientific selection of surfactants by experimental personnel.
2.Results and discussion
2.1 Thermal stability of Drop-surf fluorosurfactant in ddPCR
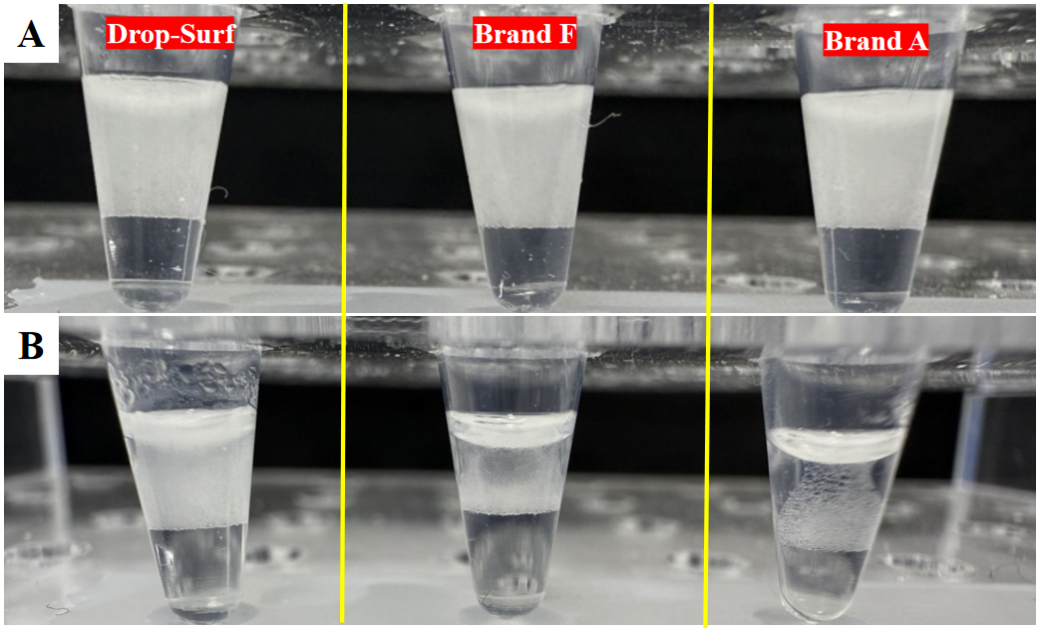
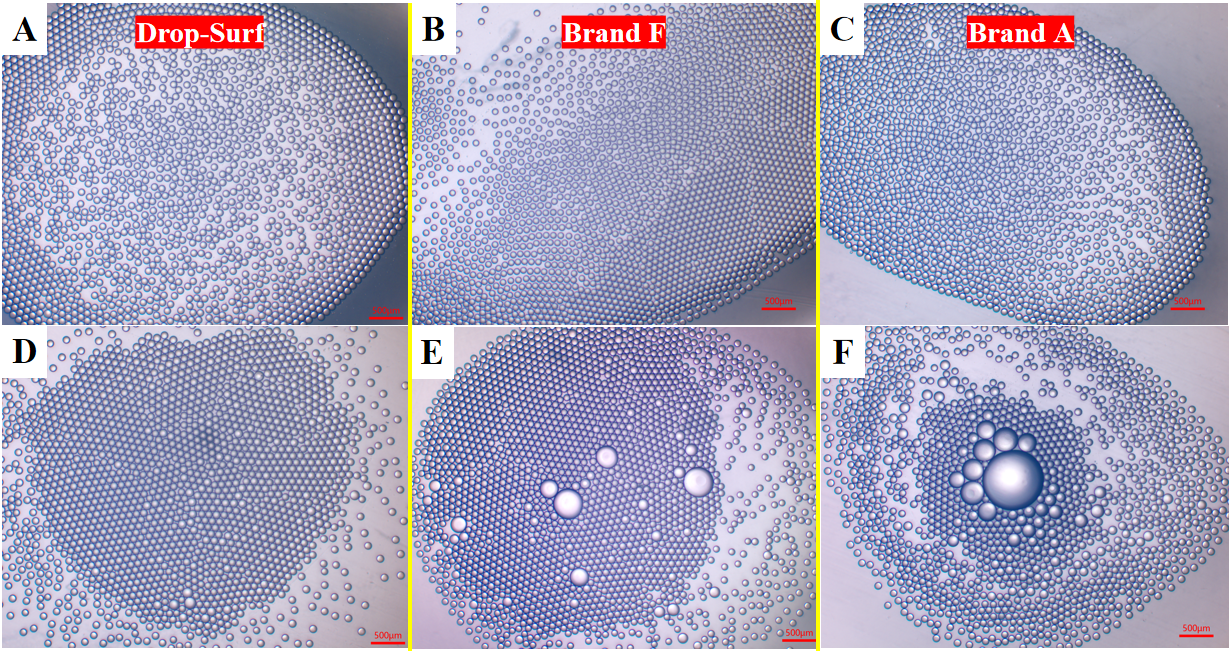
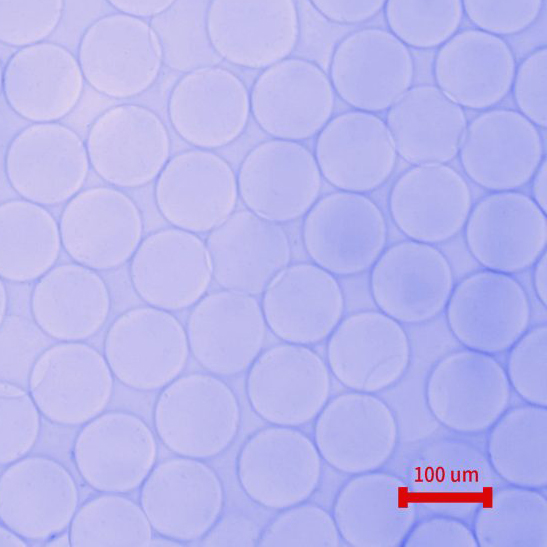
As shown in Figure 1, after ddPCR treatment, the thermal stability of droplets formed by three commercial surfactants showed significant differences. Droplets corresponding to Brand A surfactant exhibited severe coalescence, while those formed with Brand F surfactant showed slightly better thermal stability with relatively lower coalescence; droplets corresponding to Drop-Surf surfactant demonstrated relatively outstanding thermal stability, with almost no obvious coalescence observed. This result was further confirmed by the microscope images shown in Figure 2.
As illustrated in Figure 3A, following ddPCR treatment, the mean absolute variation in droplet size among the three surfactants was found to be negligible. However, significant differences were observed in monodispersity (measured by coefficient of variation, C.V.). The droplet C.V. for the surfactants from Brand A and Brand F was 22.83% and 15.41%, respectively, with both indicating a substantial decline in monodispersity after ddPCR treatment. Conversely, droplets corresponding to Drop-Surf had a C.V. of only 6.09%, demonstrating relatively excellent monodispersity. This result is consistent with the conclusions drawn in preceding analyses.
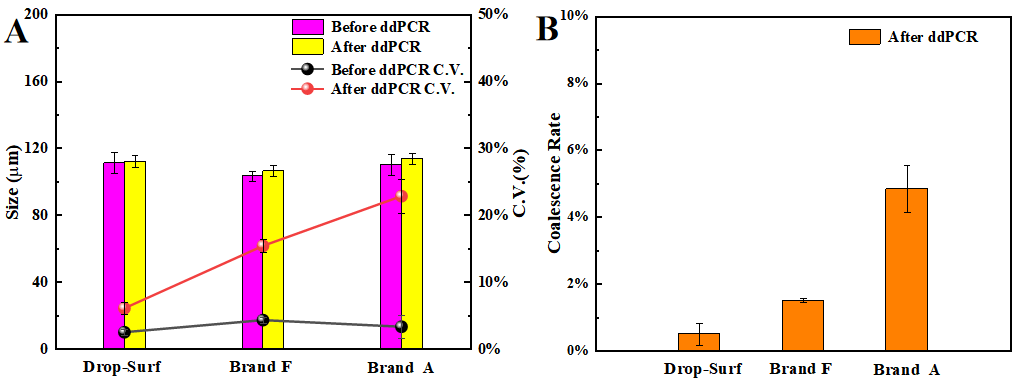
Figure 3B presents coalescence rate of droplets after ddPCR treatment. The result shows that the coalescence rates for the surfactants from Brand A and Brand F were 4.84% and 1.51%, respectively. In contrast, the droplet coalescence rate for Drop-Surf surfactant was only 0.51%, significantly lower than those of the other two surfactants. This quantitative data further robustly substantiates, from the perspective of coalescence rate, that Drop-Surf exhibits exceptional thermal stability during ddPCR processing.
2.2 Thermal stability of Drop-surf fluorosurfactant in RT
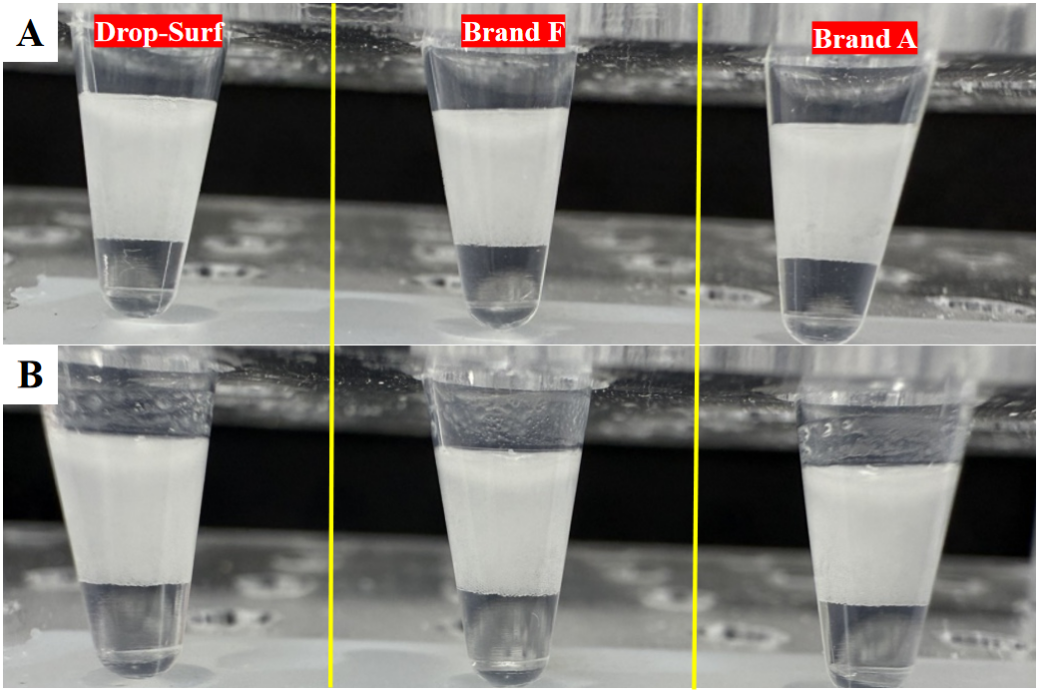
As shown in Figure 4, after RT treatment, the thermal stability of droplets formed by three commercial surfactants exhibited no significant differences, with no obvious coalescence observed. This conclusion is further compellingly supported by the microscopic comparison images presented in Figure 5, which provide visual confirmation of the consistent thermal stability among the surfactants.
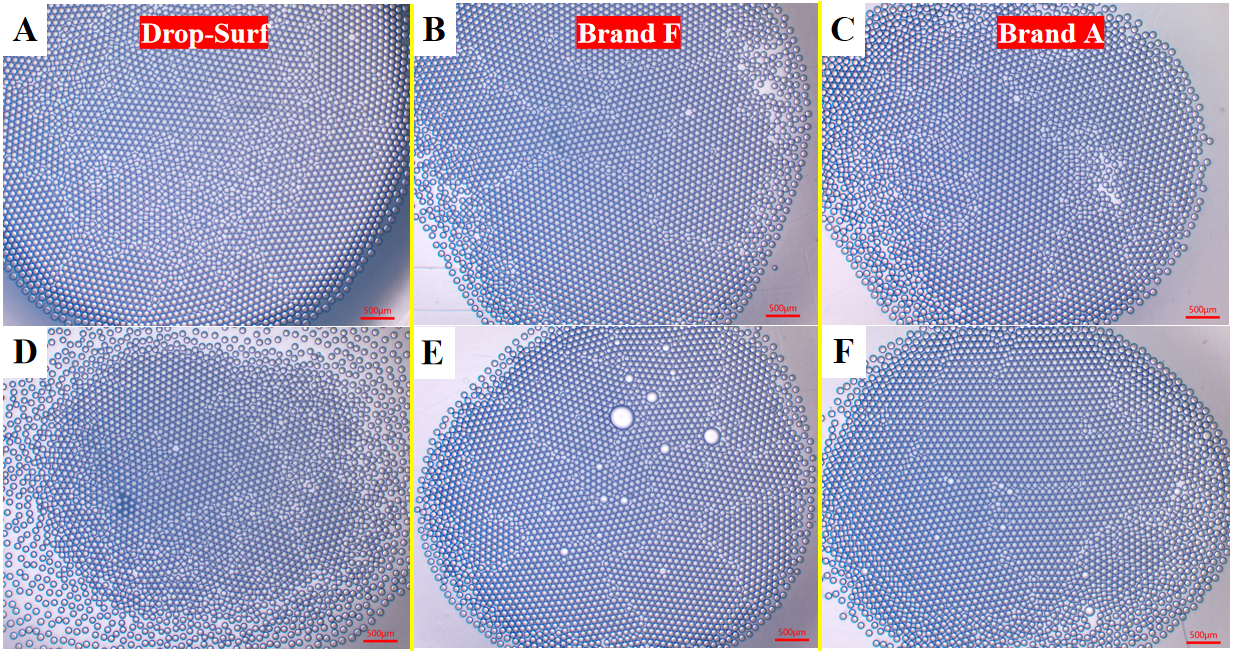
Figure 6A provides a quantitative analysis of the mean absolute variation and monodispersity among the three surfactants, both before and after RT treatment. The results offer robust additional support for the conclusions drawn previously.
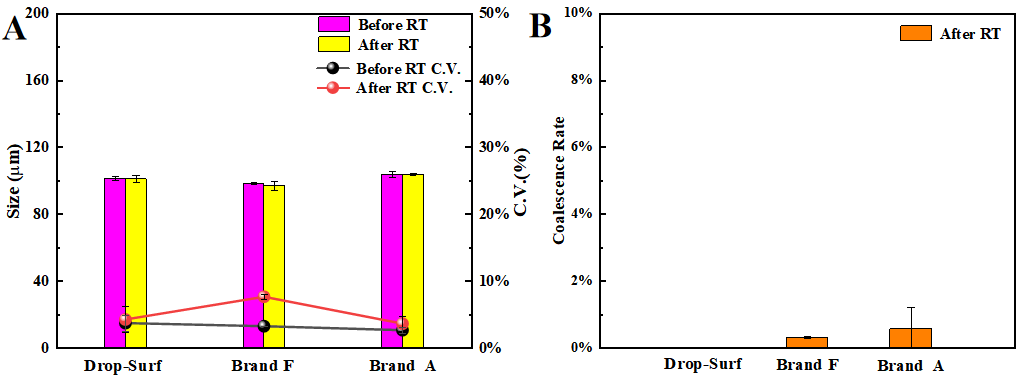
Figure 6B presents coalescence rate of droplets after RT treatment, The result shows that the coalescence rates for the surfactants from Brand A, Brand F and Drop-Surf surfactants were 0.58%, 0.32%, and 0.01%, respectively. This quantitative evidence further strongly demonstrates that the differences in thermal stability among the three surfactants are not statistically significant during RT.
3.Materials and methods
3.1 Materials and equipment
Fluorosurfactants: Drop-Surf (DGO-N-001), Brand F (a French brand), Brand A (a U.S. brand)
Base oil:3M Novec™ 7500 (HFE-7500)
Table 1. ddPCR reagents
| Initial concentration | Volume (µL) | Final concentration | |
| Tris-HCl(pH=8.0) | 1000 mM | 50 | 10 mM |
| KCl | 1000 mM | 250 | 50 mM |
| MgCl2 | 300 mM | 25 | 1.5 mM |
| Tween-20 | 10% | 50 | 0.10% |
| dd H2O | – | 4625 | – |
| Total Volume | – | 5000 | – |
Table 2. RT reagents
| Initial concentration | Volume (µL) | Final concentration | |
| Tris-HCl(pH=8.0) | 1000 mM | 250 | 50 mM |
| KCl | 1000 mM | 375 | 75 mM |
| MgCl2 | 300 mM | 50 | 3 mM |
| Glycerol | 50% | 500 | 5% |
| DTT | 1000 mM | 50 | 10 mM |
| TritonX-100 | 10% | 50 | 0.10% |
| Tween-20 | 10% | 400 | 0.80% |
| dd H2O | – | 3305 | – |
| Total Volume | – | 5000 | – |
Equipment: FluidicLab pressure controller and flow sensors, PCR instrument (Bio-Rad), ordinary optical microscope.
3.2 ddPCR test
Table 3. Droplet generation for ddPCR
| Microfluidic chip | PDMS-FF-100 |
| Continuous phase | 2% w/w surfactants dissolved in HFE-7500 base oil |
| Dispersed phase | ddPCR reagents |
| Continuous phase flow rate | 30 µL/min |
| Dispersed phase flow rate | 20 µL/min |
Table 4. ddPCR program
| Step | Temperature | Time | Cycle |
| 1 | 95℃ | 3 min | 1 |
| 2 | 98℃ | 20 s | 40 |
| 3 | 65℃ | 20 s | |
| 4 | 72℃ | 30 s | |
| 5 | 72℃ | 3 min | 1 |
| 6 | 4℃ | 10 min | 1 |
Stability evaluation:50 µL emulsion was placed in a PCR tube and tested according to the corresponding ddPCR program
3.3 RT test
Table 5. Droplet generation for RT
| Microfluidic chip | PDMS-FF-100 |
| Continuous phase | 2% w/w surfactants dissolved in HFE-7500 base oil |
| Dispersed phase | RT reagents |
| Continuous phase flow rate | 30 µL/min |
| Dispersed phase flow rate | 20 µL/min |
Table 6. RT program
| Step | Temperature | Time | Cycle |
| 1 | 42℃ | 90 min | 1 |
| 2 | 50℃ | 2 min | 11 |
| 3 | 42℃ | 2 min | |
| 4 | 85℃ | 5 min | 1 |
| 5 | 4℃ | 10 min | 1 |
Stability evaluation:50 µL emulsion was placed in a PCR tube and tested according to the corresponding RT program
3.4 Experimental design principles
Control of a single variable: Three surfactants were added at consistent concentrations with other reaction conditions unified.
Triplicate experiments: Each group was performed in triplicate to reduce random errors.
Evaluation indicators: Mean droplet size before and after reaction (µm), C.V. of average droplet size, droplet coalescence rate after temperature cycling (number of fused droplets/total number of droplets×100%)
Note: This study only reflects the performance under laboratory conditions, and the practical application performance may vary due to differences in experimental conditions.
GET IN TOUCH
Talk to our experts
CONTACT
Dedicated to providing professional standard microfluidic integrated solutions
-
315, Building 1, No. 8 Memorial Road, Yangpu District, Shanghai, China
-
+86 021-65103566